Steps for Conducting Network Analysis to Uncover Coordinated Disinformation Campaigns
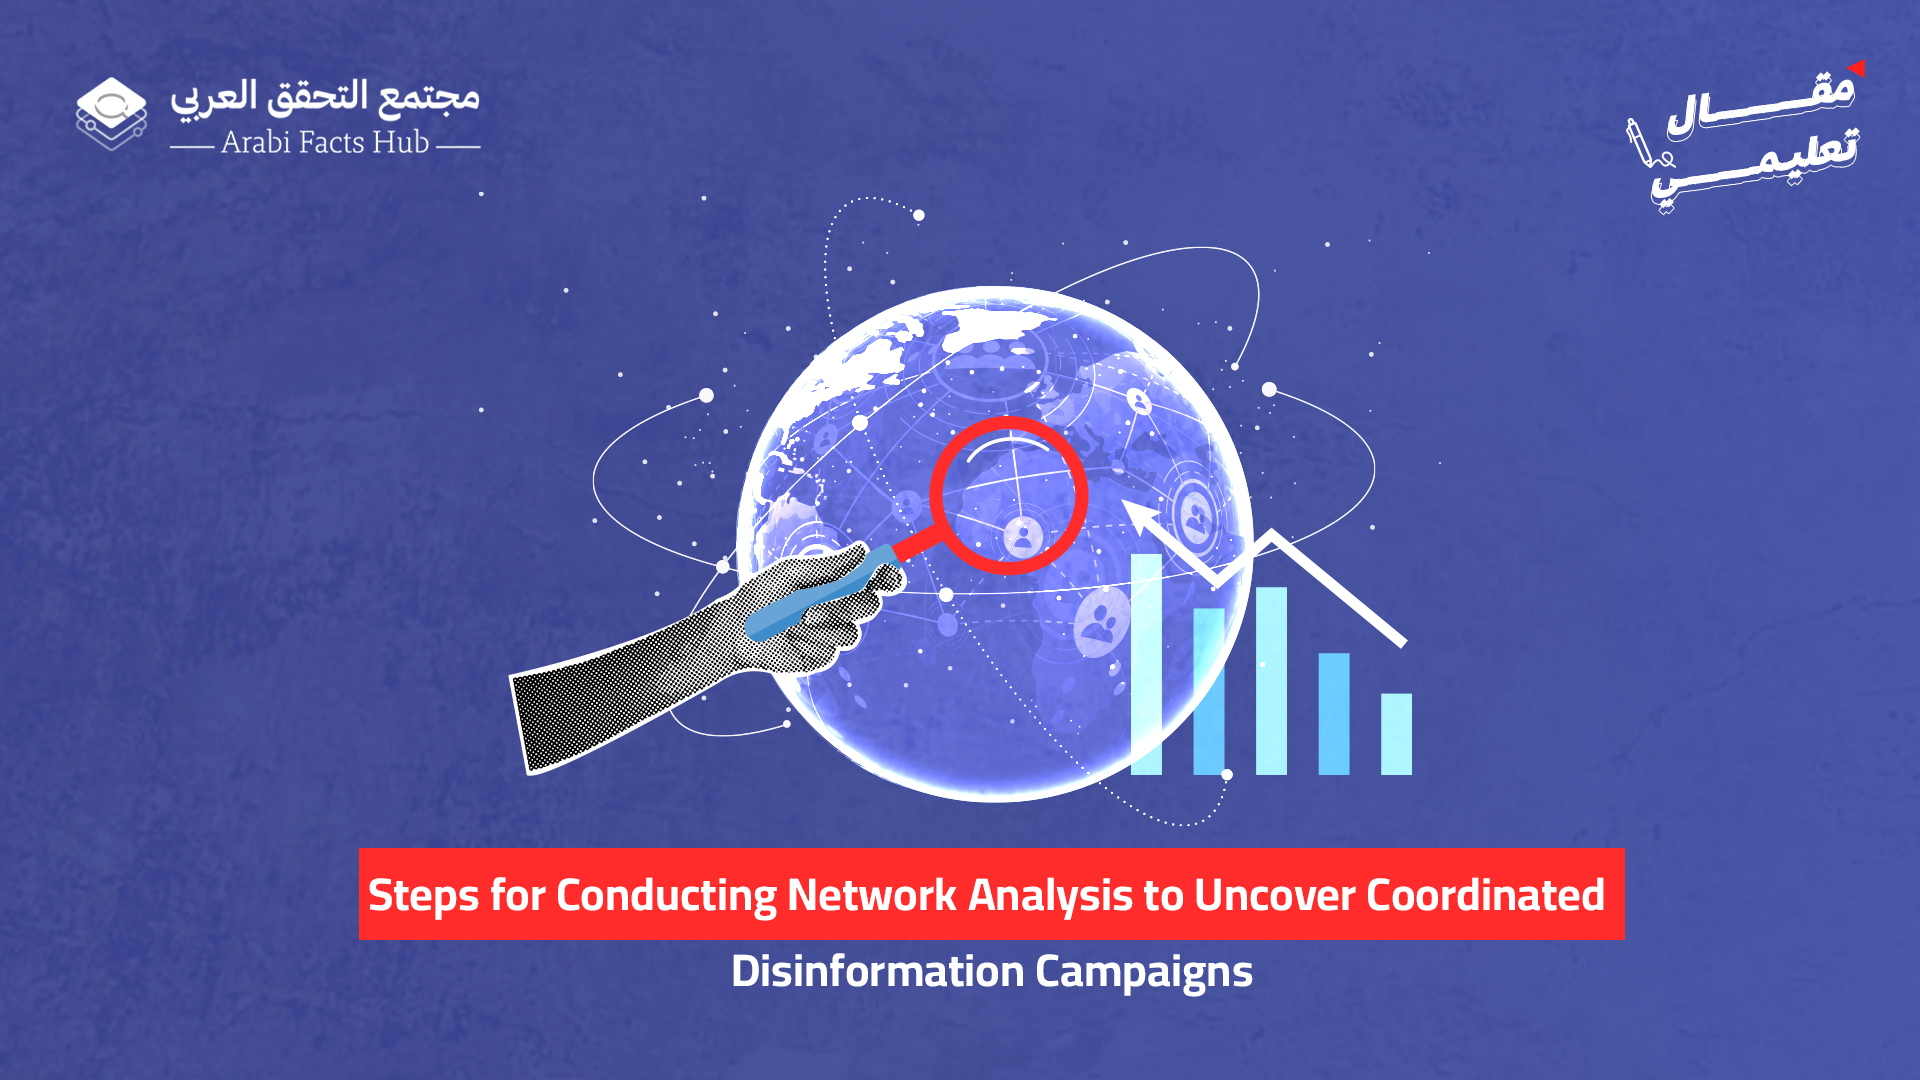
With the rise of disinformation campaigns, manipulation of trends, and the covert influence of coordinated groups and campaigns, it has become essential to use advanced analytical tools that uncover hidden connections between accounts and messages—such as data analysis, keyword tracking, and measuring reach. However, there is a more advanced analytical tool that goes beyond these traditional methods. Rather than focusing solely on content, it aims to reveal the real actors behind these campaigns: network analysis.
Network analysis is a powerful technique that allows journalists and fact-checkers to map out digital interactions between accounts across different platforms. This helps in exposing coordinated campaigns, identifying influential accounts, and tracking the spread of disinformation.
What is A Network Analysis
When we look at a post that has gained significant engagement or a hashtag that has gone viral quickly on social media, we might see it as just a passing comment or an isolated post. But what if we could see the full picture? How are the accounts connected? Who is leading the conversation, and who is amplifying it? This is where network analysis comes into play.
Network analysis, also known as Social Network Analysis (SNA), is a methodology used to study the relationships and connections between different entities. These entities can include financial, economic, and commercial institutions, with the aim of understanding the extent of overlap, partnerships, and transactions that link them. It can also pertain to influential individuals who operate covert activities behind the scenes, avoiding public visibility for fear of accountability.
”
Network analysis—also known as Social Network Analysis (SNA)—is a methodology used to study the relationships and connections between different entities. These entities can include financial, economic, and commercial institutions, with the aim of understanding the extent of interconnections, partnerships, and transactions linking them. It can also involve influential individuals who operate covertly in the background, avoiding public exposure for fear of accountability.
When applied to social media, network analysis serves to track the flow of information, interaction, and spread in order to identify the accounts driving a disinformation campaign or an attack on a particular person, and to assess the level of influence of each account involved in a given hashtag or campaign. Imagine it as a digital map where "nodes" represent user accounts and "edges" represent interactions such as reposts, likes, comments, and follows. This map does not only show who is talking to whom but also reveals how information flows, who influences whom, and who is echoing whom.
By analyzing these networks, we can uncover patterns that reveal influence and coordination—for example, clusters of accounts working together to spread specific content, or accounts that play a major role in amplifying certain messages. This type of analysis helps journalists move beyond the daily noise and understand who truly holds power on platforms like X (formerly Twitter), Facebook, and Instagram.
Given that X is one of the key platforms used to disseminate news and influence public opinion, network analysis there holds particular importance. X has unique mechanisms for content sharing, such as retweets, quotes, and mentions—all of which are essential elements in analyzing the network to understand how digital narratives spread. On the platform, influence isn't just about follower count—it’s about the role an account plays in the network. Some accounts act as hubs, serving as central sources of information. Others function as bridges between different communities. Meanwhile, some accounts amplify narratives through repeated and coordinated reposting behavior.
Network analysis on X allows journalists to understand the dynamics of coordinated campaigns using tools like centrality measurement, community detection, and synchronized interaction patterns. When a particular hashtag suddenly trends, network analysis can reveal whether its spread is organic or the result of orchestrated coordination. For example, if the network map shows a large number of accounts posting identical content within a short time frame, that is a red flag for a disinformation campaign or artificial trend manipulation. Journalists can also identify accounts that play dual roles, such as those pretending to be ordinary individuals while actually functioning as part of a broader narrative manipulation network.
How Can We Understand Network Analysis
The process typically begins by collecting interaction data from social media platforms using APIs or various scraping tools. This data can include information such as the account that made the original post, the replies it received, likes, reposts, as well as mentions or follows. When this massive amount of data is organized into a structured format—comprising fields, notes, and cells that indicate relationships or interactions between accounts—it becomes possible to construct a preliminary view of the level of connectivity between users.
Next comes the stage of building the graph, where the accounts central to spreading the narrative are represented as “nodes”, around which the rest of the network revolves, connected through “edges” that represent interactions.
The backbone of a network analysis is the process of quantification of the network structure. Quantification refers to the number of accounts that imitate or replicate the actions of central accounts. The accounts that receive the highest levels of interaction become the central nodes at the heart of the network
”
The backbone of network analysis lies in the quantification of the network structure. Quantification refers to identifying how many accounts mimic or replicate the behavior of central accounts. As such, the accounts that receive the most interactions become the central nodes at the core of the network.
Following this comes the stage of calculating network metrics, which involves focusing on specific statistical indicators to understand the influence of accounts and the roles they play within the digital ecosystem. Among these indicators is degree centrality, which measures the number of direct connections an account has—highlighting those accounts with broad networks of links. On the other hand, betweenness centrality identifies accounts that act as bridges between different clusters, serving as conduits for content transmission between otherwise disconnected groups.
Temporal analysis can also be integrated into network analysis. This allows researchers to view the network not as a static structure, but as one that evolves over time. For instance, a researcher might track when a campaign began on X or another platform, observe when post activity starts to rise rapidly, identify the peak of the campaign, and then its decline. This helps determine whether a hashtag or content spread organically or in timed, coordinated waves. Network analysis, therefore, doesn’t just show who interacts with whom—it also reveals when those interactions took place, helping journalists link the network structure to a timeline and assess whether the activity was spontaneous or orchestrated.
After this analytical phase, visual representation becomes essential for translating numbers and relationships into an intuitive map. Here, specialized tools and software (a few of which will be presented in the next section) are used to draw the network, displaying key hubs and overlapping communities with lines and color coding that allow researchers and journalists to easily detect patterns and relationships.
Finally, some researchers turn to statistical analysis to verify the significance of the patterns observed in the network—especially when trying to determine whether a subset of accounts is tightly connected or whether the timing of content dissemination reflects deliberate coordination. This last step is crucial in distinguishing between organic behavior and artificial manipulation, confirming whether the concentration of activity among certain accounts points to an organized campaign or is merely the result of spontaneous engagement.
Tools of Network Analysis
Network analysis tools vary in their complexity and the skills required to use them, but they all have the ability to map networks and measure the connectivity between their nodes. For example, Gephi is one of the most popular open-source tools, known for its diverse options in visualizing large networks. It is useful for journalists who want to quickly explore data or create visually appealing maps that help in highlighting patterns.
If you are proficient in programming languages, you can use libraries such as NetworkX in Python or igraph in both Python and R. These libraries offer high flexibility in coding and customizing algorithms. They also enable advanced analyses like community detection or calculating various metrics (including degree centrality and betweenness centrality).
For journalists needing a quick solution with minimal coding, tools like NodeXL، can be very helpful. NodeXL simplifies capturing the basic concepts of network analysis without diving deep into programming.
On the other hand, Botometer is not a full-fledged network analysis tool but complements it by detecting the likelihood that an account is a bot or automated. This provides an important indicator for researchers tracking groups of accounts that might be part of a coordinated campaign. It helps journalists identify networks dominated by automated activity, which can be a clear sign of misleading or manipulated behavior.
Additionally, platforms like Meltwater are not classified as network analysis tools but offer extensive monitoring and analysis services for digital media and social platforms. Meltwater provides in-depth real-time analytics for brands and organizations, helping track key engagement metrics and highlight influencers in campaigns, which can enable journalists to detect organized campaigns or uncover disinformation dynamics.
Practical Example of A Network Analysis
In an investigation into the interaction pattern on the hashtag #الجولاني_سفاح_سوريا (Julani, Syria’s Butcher), we employed a network analysis. The process relied on collecting interaction data from the hashtag, including original posts, reposts, replies, direct mentions, and classifying accounts according to their level of interaction and centrality within the network. While authentic digital campaigns are expected to spread largely horizontally, with interactions distributed across a wide number of users, this campaign showed the presence of a small group of accounts forming the main core of interaction, indicating organized coordination in the dissemination of content.
Network analysis algorithms were applied using the NetworkX library in Python to detect temporal repetition in interactions between accounts. It was found that some accounts reposted the exact same content within short time intervals, and groups of accounts interacted intensely among themselves far more than with other accounts. This pattern revealed closed amplification networks aimed at boosting the hashtag’s spread within specific circles before pushing it to a broader audience.
By plotting interaction timelines, sharp peaks in the number of posts were observed within seconds or minutes, followed by rapid declines — a clear indicator of directed digital boosting rather than an organic, gradually increasing movement.
The investigation also examined reposting patterns and mention distributions, revealing that a large proportion of reposts originated from a limited number of key accounts that played a role in steering the interaction. The network appeared to revolve around key hubs managed by these accounts, resembling a hierarchical amplification structure rather than a spontaneous horizontal spread. The analysis also showed that the exact same phrase was repeatedly used across many accounts’ content, which often signals deliberate coordination or the use of automated software.
Comparing the number of original posts to reposts clearly demonstrated that most of the interaction consisted of repeatedly reposted content rather than new content creation, supporting the idea of a strategy designed to amplify a limited number of posts rather than foster genuine discussion.
Finally, digital community detection techniques were applied to identify clusters involved in amplifying the hashtag. It became clear that there were several distinct yet overlapping groups, suggesting the possible involvement of multiple entities pushing the hashtag in different directions but sharing the same goal: spreading a particular narrative charged with negativity.
This type of coordinated collective action exposes digital disinformation strategies that can influence public opinion and divert discussions toward specific directions. The network analysis methodology proved effective in distinguishing organic campaigns from artificial, orchestrated ones, helping to dismantle the underlying structure driving the hashtag’s spread and uncover the accounts actually leading it behind the scenes.
Author: Sheref Mourad
